Investment Strategy

Providing objective research and guidance for your financial decisions.

A laptop displaying a financial dashboard with various stock market graphs and data. The screen shows different stock indices and their performance, including line charts and a bar chart for market overview. The laptop is placed on a light-colored table, and a gray sofa is visible in the background.
Financial Guidance

Our independent research helps financial professionals design tailored investment strategies that align with your unique goals and needs, ensuring informed decision-making for your financial future.

A person holds a smartphone displaying a financial or stock trading app, with detailed graphs and numerical data visible on the screen. In the background, there is a blurred computer monitor and office setting, suggesting a work environment.
Objective Research

We deliver unbiased insights and analysis to empower financial professionals, enabling them to create effective investment strategies that cater to your specific financial objectives and aspirations.

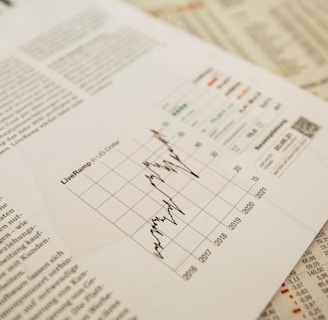
A financial report is laid out with an intricate chart showing data trends over multiple years. Surrounding text appears to be in a newspaper format, with graphs and tables prominently displayed. The focus is on a detailed line graph illustrating fluctuations.

Guidance

Independent research to help design your ideal investment strategy.

A computer screen displays a detailed financial graph with multiple lines and grids, indicating market trends over time. The background is blurred, giving focus to the graph.
A hand holding a smartphone displaying a financial website, with information including market watch and stocks data visible on the screen. The background is a textured wooden surface.